← All case studies

Ecommerce · Google Ads · Local search

The Florist Client

Growth in store sales, website traffic and local engagement.

Google AdsShopify salesGoogle Business Profile

The story

The supplied Shopify reports show rising store sales and website traffic, alongside a higher reported conversion rate. Google Business Profile reporting also shows stronger local engagement from April through August 2026. These reports cover different periods, detailed below. The client’s identity remains private.

The performance reports

A closer look at performance.

Shopify · 29 September 2025 to 29 September 2026

The wider sales picture

Shopify reports A$76,291.47 in total sales, with a displayed increase of 1.1K% against 28 September 2024 to 28 September 2025. The chart shows sales building strongly in the later months of the reporting period. This is total store sales, not revenue attributed specifically to Google Ads or a measure of profit.
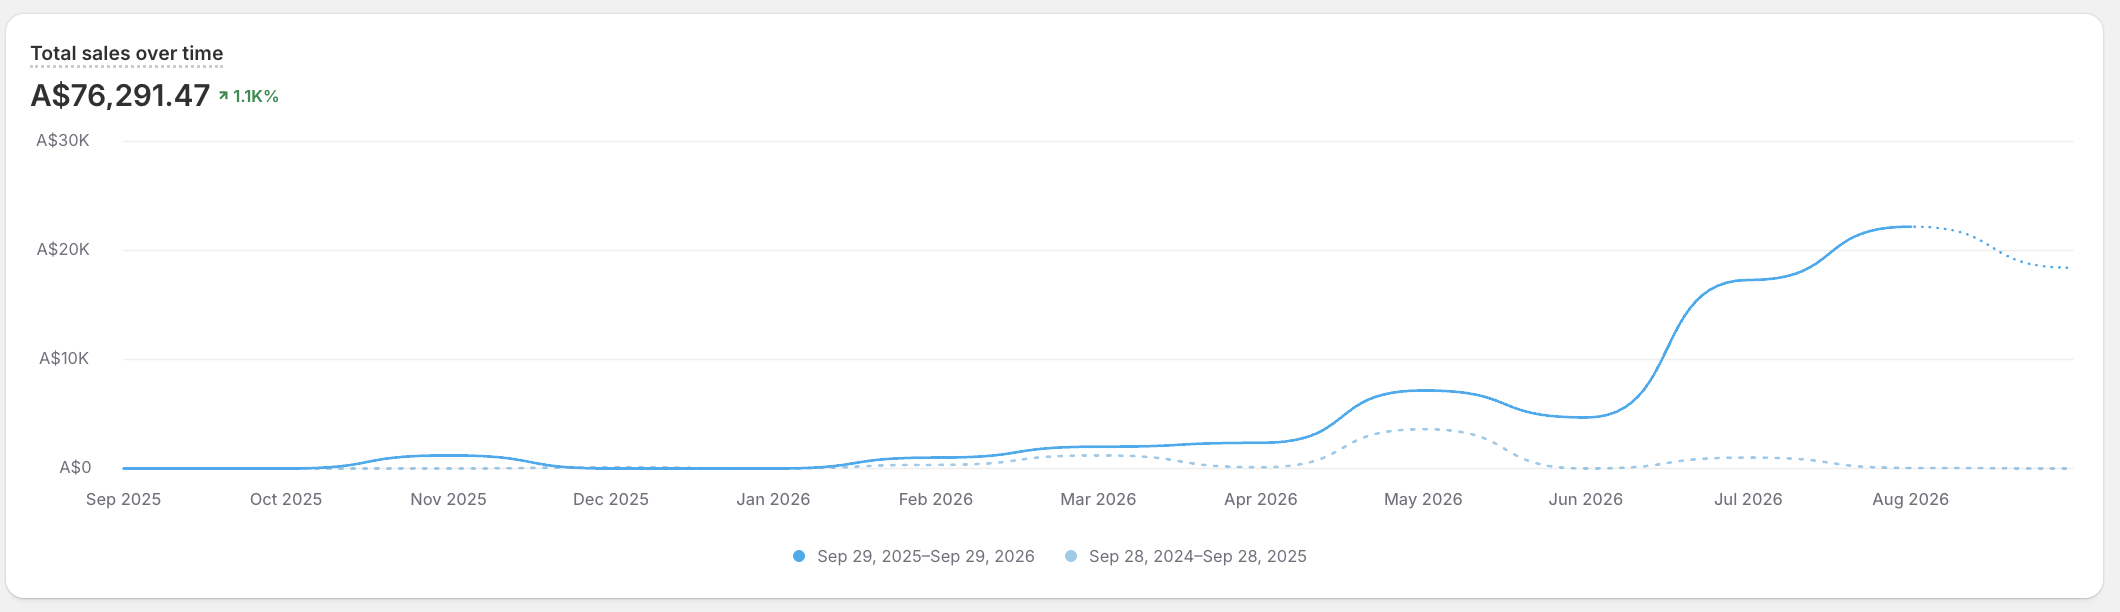
Anonymous florist Shopify total sales report showing A$76,291.47 and a displayed 1.1K% increase for 29 September 2025 to 29 September 2026 against the comparison period.
Client-supplied Shopify report. The 1.1K% change is Shopify’s rounded display. Sales channel mix, refunds and tax treatment are not detailed in this screenshot. View full-size screenshot ↗

Shopify · 29 September 2025 to 29 September 2026

More sessions and a higher reported conversion rate

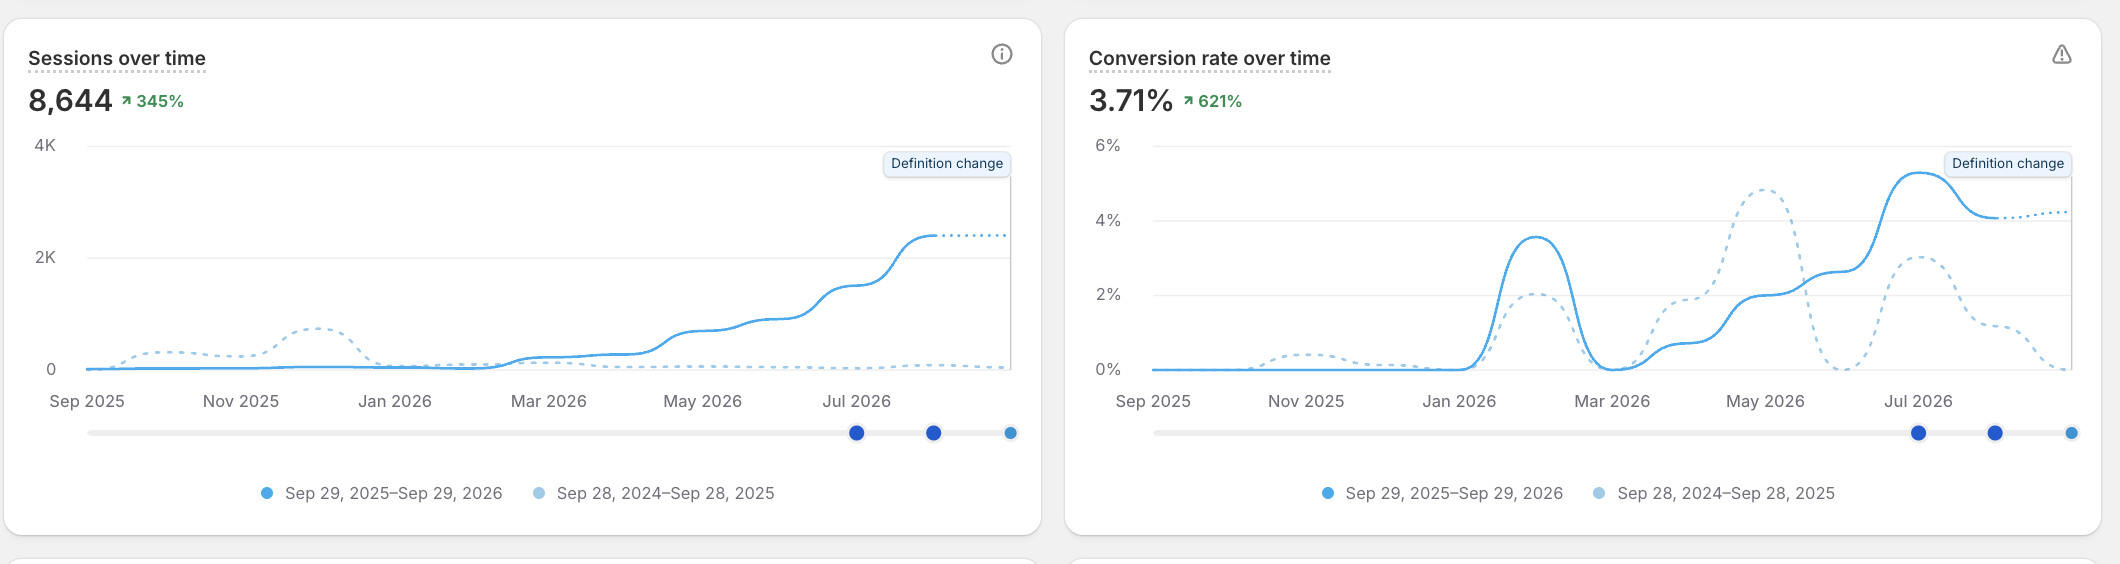
The report shows 8,644 sessions, up 345%, and a 3.71% conversion rate, up 621%, against 28 September 2024 to 28 September 2025. Both charts include a definition-change marker, and the conversion chart shows a warning indicator. The figures are reproduced as reported; the definition changes need to be checked before treating the percentage increases as fully like-for-like.

Anonymous florist Shopify report showing 8,644 sessions, up 345%, and 3.71% conversion rate, up 621%, with definition-change markers visible.
Client-supplied Shopify sessions and conversion report. Percentage changes are relative changes, not percentage-point increases. Reporting definition changes are visible in the original screenshot. View full-size screenshot ↗

Google Business Profile · April to September 2026

Stronger local engagement

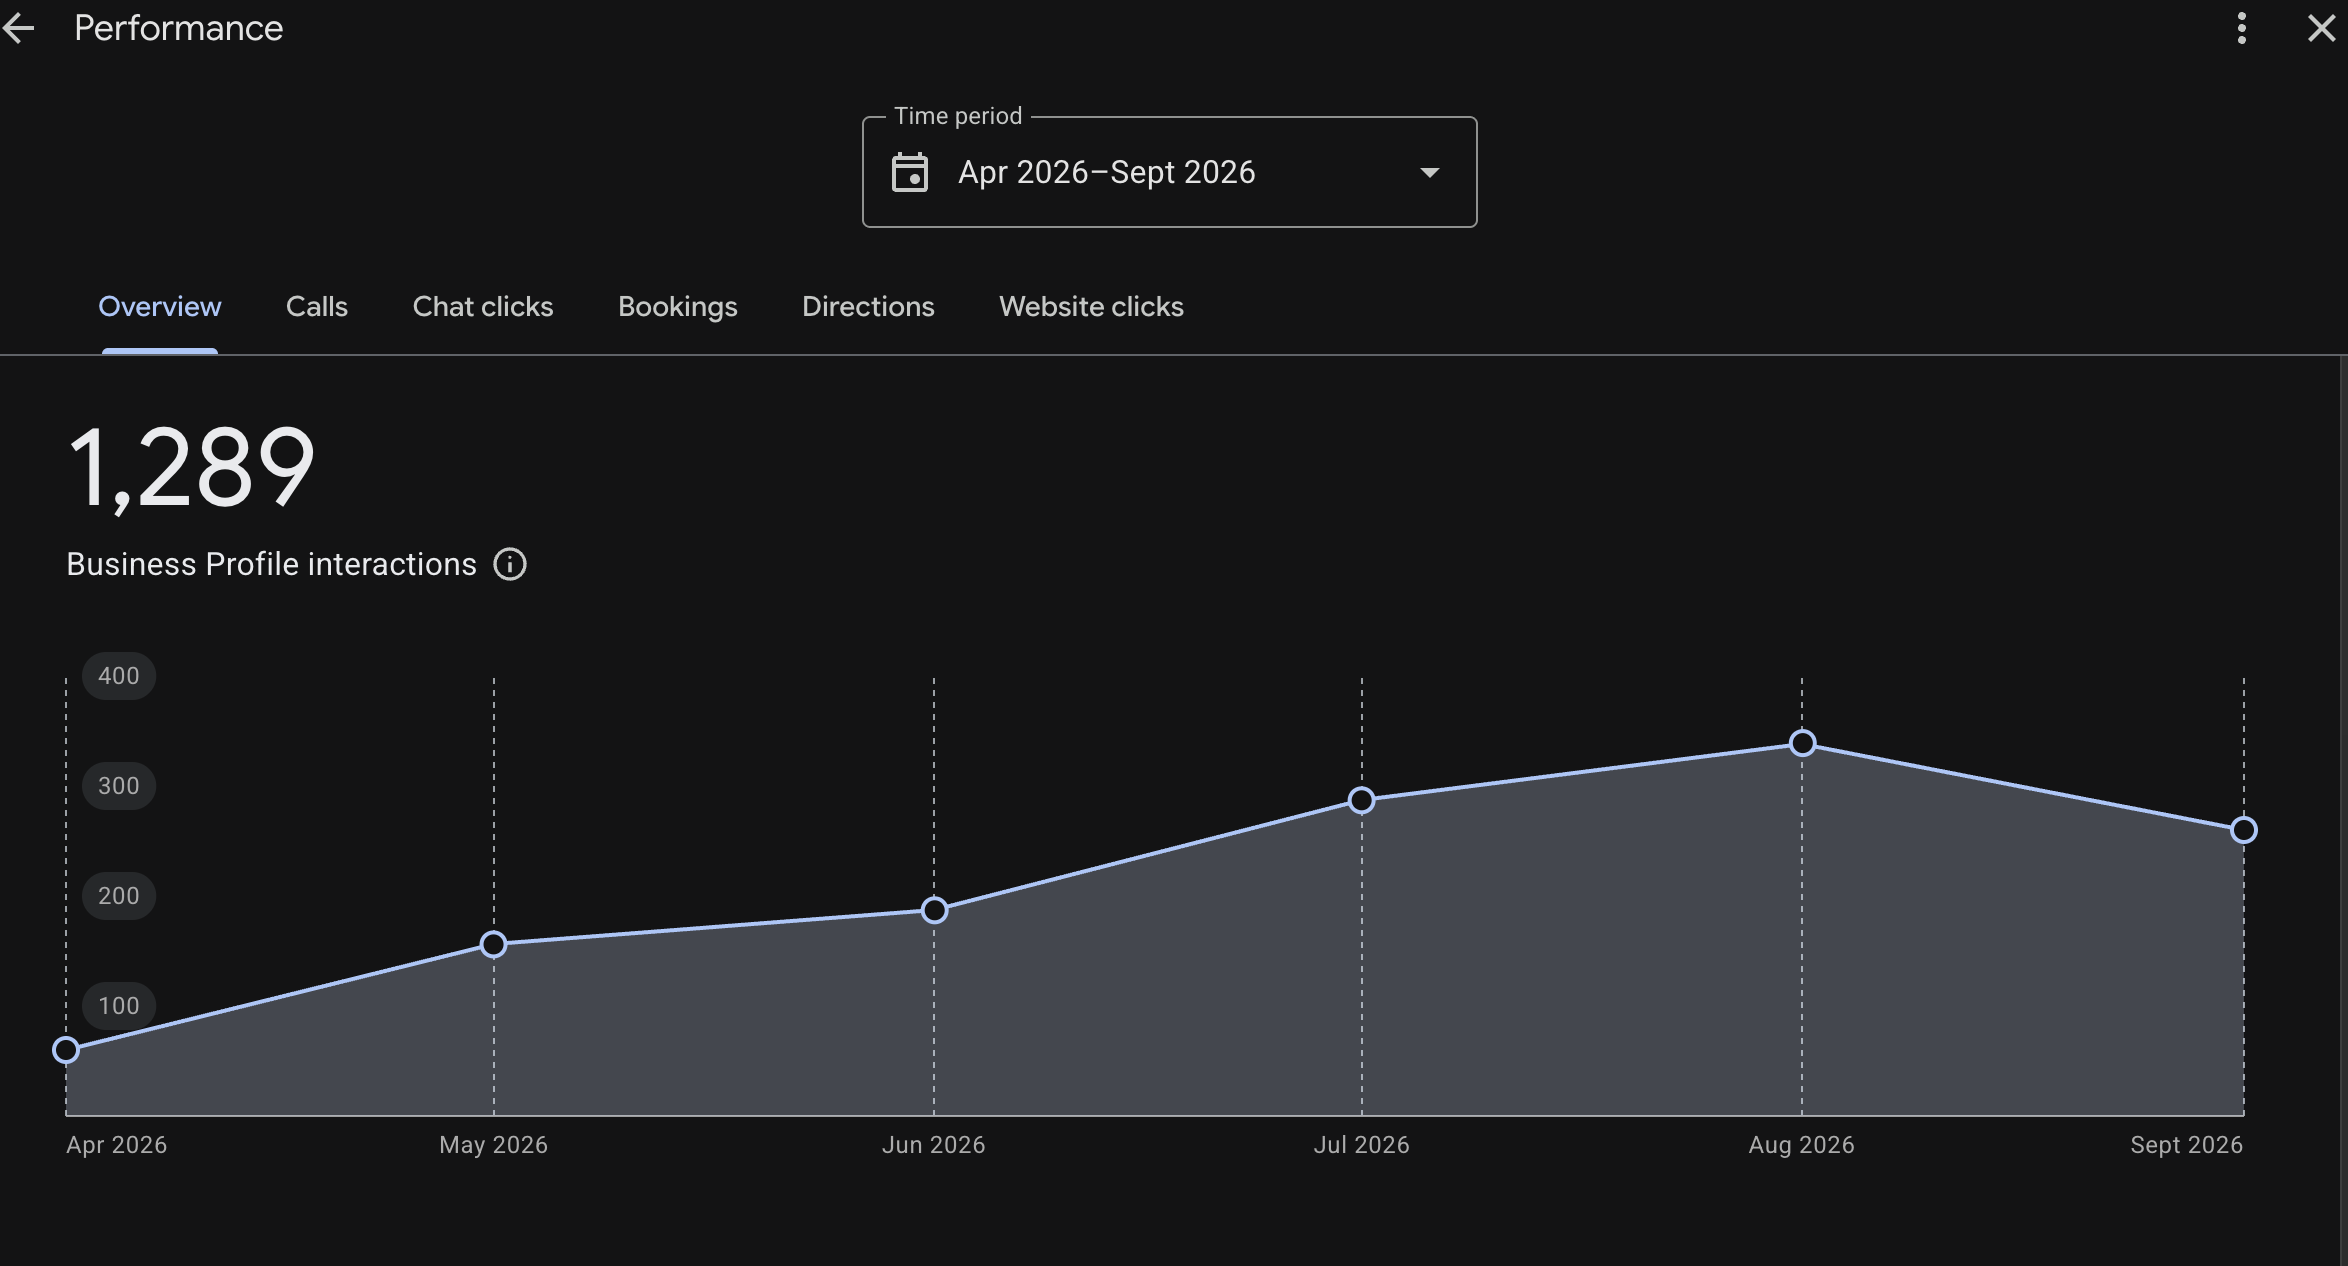
Google Business Profile records 1,289 interactions for the selected April to September 2026 period. The chart rises from April to an August peak before easing in September. The capture was supplied during September, so the final month may be incomplete. Interactions are profile actions, not a count of unique customers or confirmed sales.

Anonymous florist Google Business Profile report showing 1,289 interactions from April to September 2026, rising to a peak in August.
Client-supplied Google Business Profile overview. Individual calls, website clicks and direction requests are not broken out in this screenshot. View full-size screenshot ↗

Google Ads

Advertising performance

Ad spend, purchases and reported conversion value will be added once supporting Google Ads reports are available. Store sales above are kept separate from advertising-attributed revenue.

Advertising results coming soon

Google reviews

Customer reviews

Dated review counts and ratings will be added when the supporting screenshots are available.

Review comparisons coming soon